In this preliminary design, we will try to evaluate as closely as possible the wind and solar relative contributions as well as the various heat-losses of the system.
The case study was done for a place close to Dunkerque in the north of France, since it is the most suitable place in France. We could get the required meteorological data on a month-per-month basis.
It is very important to work-out the month per month contributions and heat-losses, in order to reconstitute the precise evolution of the temperature of the seasonal storage water-tank, and therefore the heating autonomy over the year.
We can anticipate that the solar inputs will be more important in summer, whereas winds are generally stronger in winter together with the heating requirements. Since heat-losses of the water-storage are not negligible even if it is thoroughly insulated, it is mandatory to know the timing of the heat-flows to evaluate the evolutions of the water-tank temperature, and the eventual yearly autonomy of the solution.
We are confident that the implementation in a country like Scotland, Denmark or Norge, would even more justify the proposed solution, as the only one possible using alternative energies.
Nevertheless the sizing of the various constitutive elements could be different for each case.
8.1_Wind power contribution:
When the required Weibull parameters (k and beta) of the wind are known for a given period of time, the Weibull-law allows a very good approximation of the probable density distribution of the wind speeds. It is then a lot easier to manipulate formulas than tables of measurements, in the calculations.We could obtain the mean wind-speed, and the shape parameter "k" for each month of the year in Dunkerque. The Weibull function gives us the percentage of time of the month when the wind will blow with a given speed. We can therefore reconstitute for each month, a curve like the following one (as an example):

The cumulated area under the curve amounts to 1 (100% possibilities)
This curve must be mapped to the characteristics of the windmill power versus the wind-speed as follows.

For each value of the wind-speed we will multiply the corresponding power by the probability of occurrence, and then we will add-up those products and multiply them by the hours, to work-out the recuperable wind-energy over the considered month.It should be noted that the the resulting energy will be all-the-more favourable that the probability density distribution has its maximum dragged to the right side. Its shape effectively depends on the values of the Weibull "beta" and "k" parameters as shown on the following curves:

The higher the beta parameter (called "c" in this drawing), the more the recuperated energy.
In Dunkerque it varies between 6.3m/s and 8.3m/s according to the considered month.
In Scotlant it should be even higher.

The higher the "k" parameter, the more the recuperated energy.
In Dunkerque k=2.2
In Scotland it is expected higher.
As an example the corresponding curves for the month of January in Dunkerque are as follows:

Note: For the calculation of the power delivered by our windmill, a Cp coefficient of 38% has been entered, in consistance with the design in chapter 7

The curve in green represents such a standard machine with about the same size (5.6m), equipped with a 6kW generator.
Above 11m/s, the electric power is limited to 6kW, whereas the power of our windmill continues to grow strongly, so that even for the corresponding low probabilities of wind (red curve), the contribution to the overall produced energy is still very significant.
The produced electric energy would then be 1850kWh only in january, instead of 2313kWh (20% less). This is an (additional) argument against the alternative solution using a standard wind-generator and an electric resistor immersed in the water-tank, to heat the building (see also comments in chapter 2).
When considering the complete year in Dunkerque,the overall windpower contribution to the heating of the building will be as follows, assuming an efficiency of 80% for the servo-mechanism of the stirrer:

8.2_Solar power contribution:
The solar power contribution to the heating of the building has been worked-out using an on-line software.The overall area of the 30° tilted structure of the roof being 180m², we have considered a usefull panels area of 160m², since we have considered to use standard rectangular models of solar panels.
They are characterized by the following design parameters: B=0.75 and K=3.5W/m².°C
The following month per month heating contribution of the solar heating panels results:

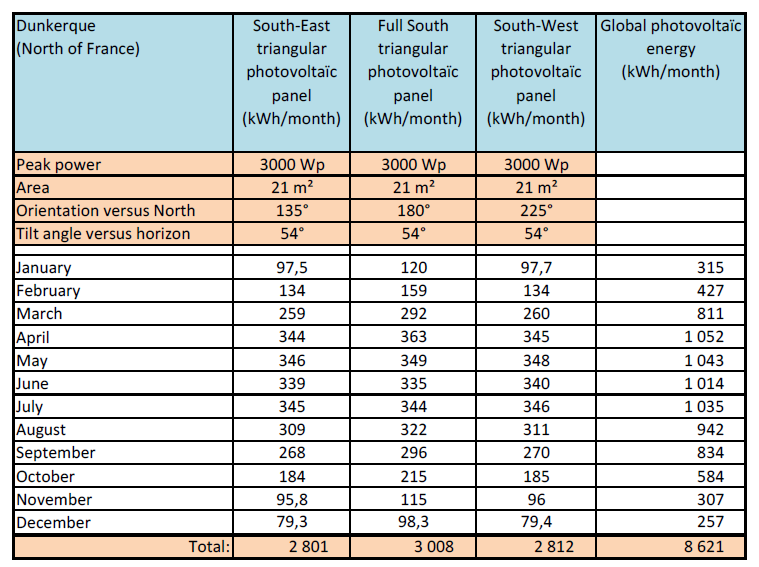
As concerns the photovoltaic energy, we have considered a tailor-made trapezoidal design for the panels, to equip the three southern sides of the pyramidal-shape junction between the roof and the tower.

8.3_Heat-losses of the building:
A preliminary evaluation of the heat-losses of the building, taking into account the aeras and the thermal-characteristics of the constitutive materials.
In this evaluation, half of the rectangular windows of the building have been removed, comparatively to the illustrations of the building already used, in order to lower the heat-losses.

An important contribution (31%) to the heat-losses comes from the air-renewal rate. It has been estimated to renew 40% of the total living volume each hour. This strategy could be adapted according to the actual conditions. It should also be taken into account that the new air will be ingressed through a Canadian-well, which should enhance the global efficiency.
We have considered that the building would be used as an office and heated only during 10 hours per day. Taking into consideration the local meteorological conditions prevailing in Dunkerque, it comes:

8.5_Summary of the heat flows:
It is very interesting to make a summary table, showing the various heat-flows, month per-month:
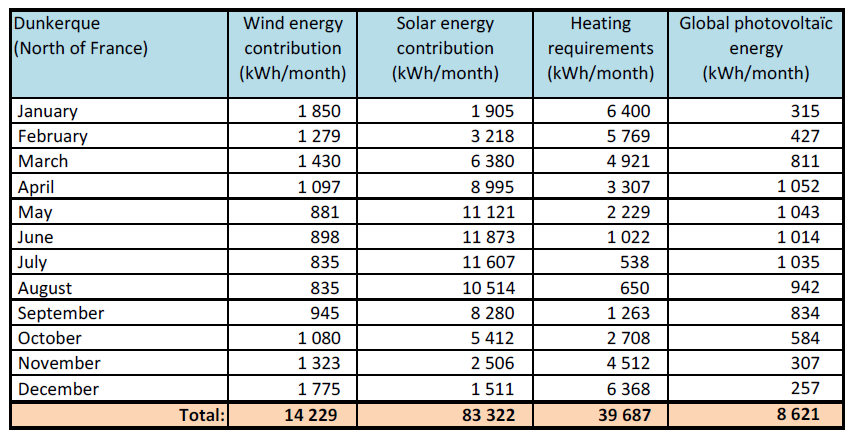
We remark that the wind-energy contributions are very significative compared to solar-energy, all-the_more in winter.
The solar power brings the most important contributions, but of course completely out of phase with the heating requirements of the building. The insulation of the seasonal storage will ensure its conservation till the next winter.
Also, the overall heat transfers towards the storage water-tanks amount to 97500kWh, more than twice the annual heating requirements.
Taking into account a ratio of about 4 for the efficiency of the heat-pumps, 32000kWh of heating-contribution could even be added, if necessary, still within the autonomy of the system.
It is possible that this design is a little oversized for an implementation in Dunkerque. Nevertheless, it would be easy to adjust the number of solar-heating panels according to the on-site results.
It would be necessary now, to work-out the month-per-month evolution of the water-tanks temperature, all over the year, on the second year of operation when the system is stabilized.
No comments:
Post a Comment